1. Empower Yourself
The nutrition world is certainly a moving target, in terms
of the debates that rage on about which of the macronutrients are
healthier as foci for your diet. In my humble opinion, neither the
status quo public health recommendations nor the latest inflammatory
food blogs are reliable enough to slavishly follow. There’s never been a
better time to take the bull by the horns and do your own
research.
Most geeks who are aiming for fitness have some kind of goal in
mind (e.g., getting leaner, building muscle, building a baby). While we
all understand that eating doesn’t require a preparatory biochemical
analysis (in fact, that preoccupation would probably ruin the meal
before the waiter ever brought it—particularly for your dinner
partners), dietary matters do entail the constant launching of complex
chemical reactions in your body, as well as providing the materials for
your own cells over and over again as they are regenerated by the
trillions.
Therefore, understanding some of the basics behind food
constituents can only be empowering. All knowledge without coercion or
propaganda is a form of personal enlightenment.
In fitness terms, by eating, you’re basically rebuilding yourself,
and your level of fitness starts with
nutrition.
2. Macronutrient Ratios
We’ll start by discussing what a macronutrient ratio (MR) is,
because this term comes up a lot in food discussions and provides a
snapshot of the contents of your typical food intake.
Some people want to fine-tune their MRs, for example, in order to
add lean mass (a bit more protein and calories in general), lose some
extra fat (tightly connected to the previous goal), or subtract some
carbs because they’re not doing the “Race Across America” bike race
anymore. The ratio falls into the “good to know” category; check on it
once and you’re good to go, unless you have to radically change your
dietary components.
After discussing MRs, we’ll move on to descriptions of each of the
three macronutrients and what happens during digestion (because the
carbs, fats, and protein that go into your mouth are reformulated—mostly
ripped apart—by the time they hit your bloodstream and body
cells).
2.1 The Ole 30-50-20 Maneuver
When you eat a typical meal or snack, you usually consume
portions of all three macronutrients: carbs, fats, and protein. Unless
you’re nibbling on a stick of butter (100 percent fat by
calories), for example, your breakfast might contain carbs
and maybe a tiny bit of protein (fruit); carbs and some protein
(toast); or fats, protein, and perhaps a few carbs (meat and
eggs).
Note
You generally don’t have to obsess over your
macronutrient ratio if you aim for a variety of real food: veggies,
fruits, eggs, cheese, fish, meats, sweet potatoes, nuts, rice, etc.
These choices should allow for settling into a sensible and healthy
ratio without knowing exactly what it is. It’s not as if a hawk ever
flies up into the air with the aim to “bump up the fats in my
macronutrient ratio.” With some nudging in the right direction, it
should come naturally.
The MR is the breakdown of the percentage of calories taken up
in the food by each nutrient, as in 30 percent carbs, 50 percent fats,
and 20 percent protein. As the lingo goes, this would be a 30-50-20
ratio. Various essential micronutrients, such as vitamins and
minerals, are in there too (hopefully!), but they are tiny by weight
compared with the macros .
Figure 1
shows a FitDay (www.fitday.com)
breakdown of what I had for breakfast this morning, about 460 calories
worth of fried eggs, fruit, and cheese. Each of the fat grams is worth
about 9 calories, while carbs and protein add up to about 4 calories
each.
Note
The term kcal or “kilogram calorie” is a more
precise term in nutrition than “calorie.” It means the amount of
energy required to raise the temperature of a kilogram of water 1
degree Celsius. “kcal,” however, has the same meaning as “calorie”
in the context of this discussion.
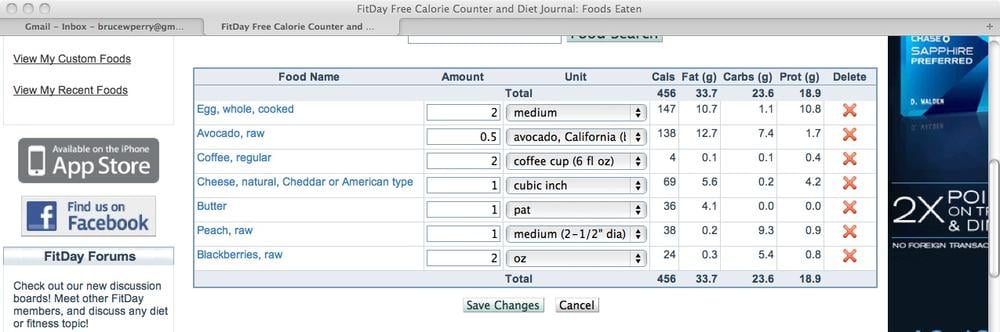
Figure 1. Eggs, fruit, and cheese for breakfast
The MR for this small meal was 19 percent carbs, 64
percent fat, and 17 percent protein, as shown in Figure 2. The shorthand
way to describe this ratio is 19-64-17. A macronutrient ratio is
generally one piece of data out of a big nutrition picture. If you
really wanted to analyze your nutrition inputs, you would be better
off calculating the MR for a typical week of eating, along with your
calorie intake (i.e., 2,400 calories per day) and perhaps your
activity levels, to put all the data into a proper context.
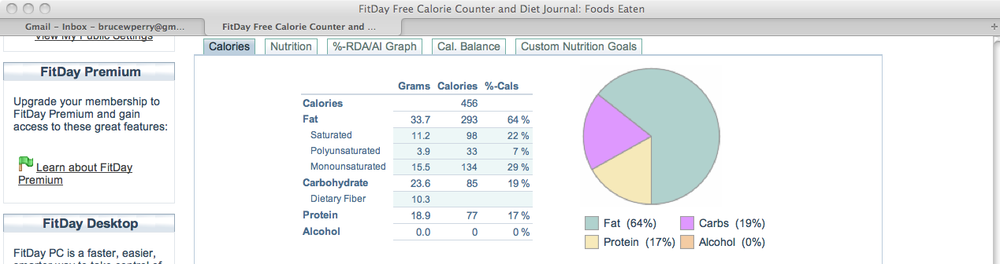
Figure 2. The macronutrient ratio for a small meal, displayed on
FitDay
In this small 460-calorie meal, the ratio of fats was much
higher than carbs, even though I ate less than 10 more fat grams,
because fats have more than twice the calorie or energy content of
carbs. They are thus considered energy-dense
foods. The wine, beer, or other alcohol you might drink (actually
containing the chemical ethanol) has about 7 calories per gram.
As you may already know, recommendations for an ideal
macronutrient ratio range all over the map. Figure 3 shows the MRs
for a number of popular diets, including the Mediterranean, Zone,
DASH, South Beach, Atkins, and Ornish eating plans. They range from
high-carb diets (e.g., Ornish) to low-carb, higher protein plans,
which is often another way of saying high-fat diets, because the
majority of calories are obtained from fat (e.g., Atkins). Figure 3 is derived from
a 2008 article in the American Journal of Clinical
Nutrition called “Alternatives for macronutrient intake and
chronic disease.”
The featured eating plans differ wildly from each other; just
look at Ornish (75 carbs-7 fat-8 protein) compared with Mediterranean
(46 carbs-38 fat-16 protein). Each specially designed diet seems to
spawn another one. I’ve often wondered why no one has invented the
“Symmetrical Diet” or “Perfect Synchronicity” involving an exact
partition of calories for all three macronutrients: 33-33-33. Not
catchy enough? Or maybe I just haven’t looked hard enough; it must be
out there.
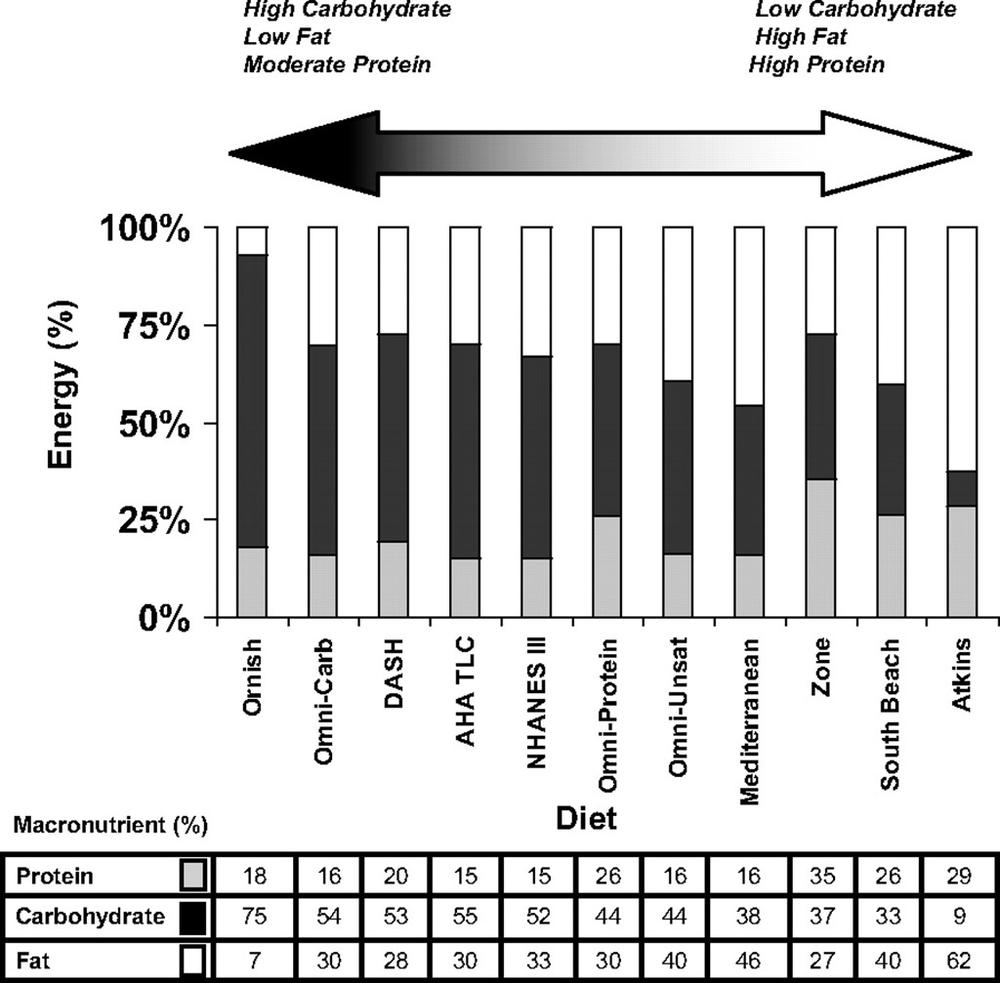
Figure 3. The macronutrient ratios for several popular diets
(www.ajcn.org/content/88/1/1.full.pdf+html
If the numbers begin looking more and more like the offerings of
a roulette wheel, then maybe constantly pondering and switching
between them is equivalently meaningful to playing casino games with
your food. Meanwhile, the Food and Nutrition Board of the Institute of
Medicine, a US public health authority, has produced its own
guidelines involving MRs. They are called Acceptable Macronutrient
Distribution Ranges (AMDRs).
Note
These are ranges of percentages that the Food and
Nutrition Board of the Institute of Medicine recommends for each
macronutrient, as follows: carbs, 45 to 65 percent for all age groups;
fat, 20 to 35 percent depending on age; and protein, 10 to 35 percent.
These numbers leave room for all kinds of diets, including ones
dominated by carbs (65 percent), even though the accompanying comments
point out that “the higher range” of carb intake leaves you open to
high triglycerides and low HDL cholesterol.
For example, based on these recommendations, you could have a
diet that is 65 percent carbs-20 percent fat-15 percent protein, or
one that goes in a dramatically different direction: 45 carbs-30
fat-25 protein. In other words, there’s a lot of wiggle room within
the conventional wisdom.